If you work in football long enough, you will hear the same question in different forms: what is xG, and why does everyone keep talking about it? xG stands for expected goals. It is a way of estimating how likely a shot is to become a goal based on the situation it came from. For coaches and analysts, it helps separate chance quality from emotion, noise, and final scoreline variance.
That matters because results can lie in small samples. A team can score twice from poor shots and look clinical, or fail to score from three strong chances and look blunt. xG gives you a better starting point for discussing performance. It is not a complete verdict on a match, but it is a useful decision-support stat when you want to explain how good the chances really were.
This guide explains xG in football, how to read it properly, where it helps, where it misleads, and why an xG shot map often communicates the story of a match more clearly than a raw spreadsheet of shots.
What Is xG in Football?
xG, or expected goals, assigns a value between 0 and 1 to each shot. A shot worth 0.10 xG is scored roughly 10% of the time in similar situations. A shot worth 0.60 xG is a much better chance and would be expected to become a goal far more often.
Instead of asking only whether a shot went in, xG asks a more useful performance question: how good was the chance? Over a full match or several matches, adding those shot values together gives you a picture of the quality of chances created and conceded.
For example, if Team A finishes with 2.1 xG and Team B finishes with 0.7 xG, the basic takeaway is that Team A created better chances overall. That does not guarantee Team A dominated every tactical detail, but it gives the staff a more grounded starting point than final score alone.
How xG Is Calculated
xG models are built from large shot datasets. They look at the characteristics of past chances and learn how often similar shots became goals. Different providers use different models, but they usually consider factors such as:
- Shot location and distance from goal
- Angle to goal
- Shot type, such as foot, header, or volley
- Game situation, such as open play, corner, or free kick
- Sometimes additional context depending on the dataset and model
The key point for coaches is not the exact mathematics. The useful takeaway is that xG compares each attempt against many similar attempts. A tap-in from close range will usually carry a high value. A speculative shot from 30 yards will usually carry a low value.
That is why xG is best understood as a probability estimate, not a promise. It tells you how a chance tends to perform historically, not what must happen on one specific shot.
Why Coaches and Analysts Use xG
xG helps football staff move from opinion to evidence. If your team scored from two low-value shots but created little else, the attacking process may still need work. If your press forced repeated high-value recoveries and central finishes but you missed them, the process may actually be healthy.
For coaches, xG supports clearer player conversations. It is easier to explain chance selection when you can compare shot quality rather than just counting attempts. For analysts, xG helps frame pre-match and post-match reviews around repeatable patterns: final-third access, box entries, cutbacks, central overloads, or low-percentage shooting from poor areas.
Used well, xG helps answer practical questions:
- Are we creating chances from good zones or settling too early?
- Are we conceding big chances or just harmless volume?
- Did our attacking structure improve shot quality, even if finishing did not?
- Which players are getting into valuable positions consistently?
What xG Can and Cannot Tell You
xG is useful because it adds context to shots. It is limited because football is more than shots. Expected goals does not fully capture build-up quality, pressing success, rest defence, tempo control, or whether your structure consistently led to the right player arriving at the right moment.
It also should not be used as a blunt conclusion tool. A team with higher xG did not automatically dominate every part of the match. They may simply have produced the better chances in a game that was otherwise balanced. In the same way, a low xG total does not automatically mean a team attacked badly if the game state, red cards, or tactical objectives shaped the approach.
The best use of xG is as one layer inside a broader review. Pair it with video, field tilt, possession patterns, pressing data, and simple tactical observation. That is when it becomes genuinely useful rather than internet scoreboard theatre.
How to Read an xG Shot Map
A good xG shot map does more than list shots. It places them on the pitch so you can see where the chances came from, how dangerous they were, and whether the pattern supports your tactical reading. This is where expected goals becomes easier to communicate to players and staff.
When reading an xG shot map, focus on three things first:
- Volume: How many shots did each team take?
- Quality: Which shots carry the biggest xG values?
- Location pattern: Are the chances central, close-range, wide, crowded, or mostly speculative?
If one team has fewer shots but several big circles near goal, that can be more dangerous than another team taking 18 low-value efforts from distance. The visual makes that obvious far faster than a table of decimals does.
That is also why an xG shot map is more useful than a raw shot count. Ten shots tells you almost nothing on its own. Ten shots from the edge of the box tells a different story from ten shots inside the six-yard area. The pitch view shows the difference immediately.
Common Mistakes When Using xG
The most common xG mistake is using it as a final judgement rather than a conversation starter. xG should guide review, not end it.
- Overreacting to one match: Single-game xG can be noisy, especially with penalties, red cards, and late game-state shifts.
- Ignoring shot context beyond the model: Some models do not capture every defensive pressure detail or body orientation cue.
- Confusing volume with danger: More shots does not always mean better attack quality.
- Skipping the video: Numbers without visuals can hide why a pattern happened.
- Treating xG as a finishing grade only: It is just as useful for discussing chance creation and shot selection.
The smartest workflow is simple: use xG to flag patterns, then check the video and pitch locations to understand the tactical reason behind those numbers.
Turn xG Into Clear Visual Analysis With DrawTactics
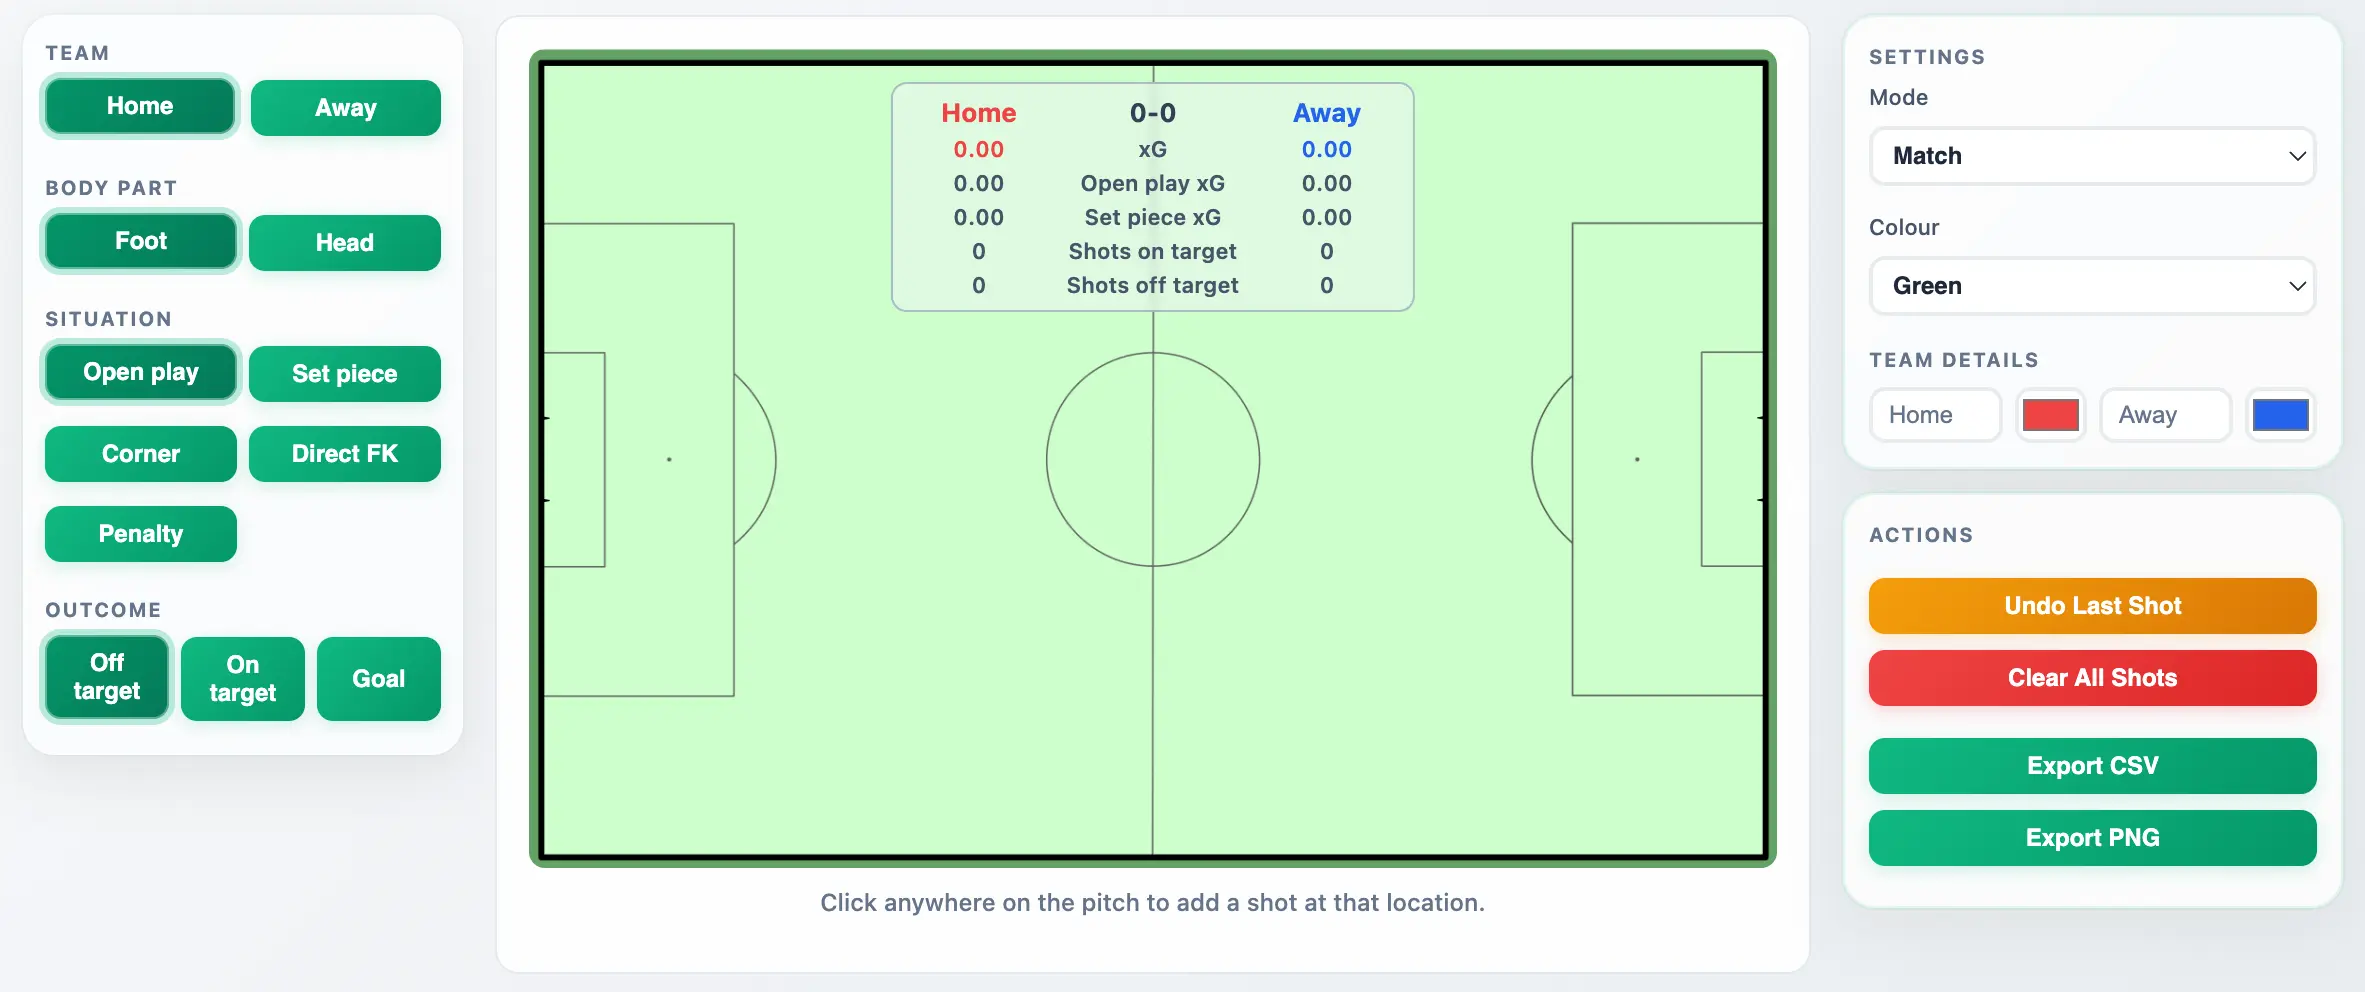
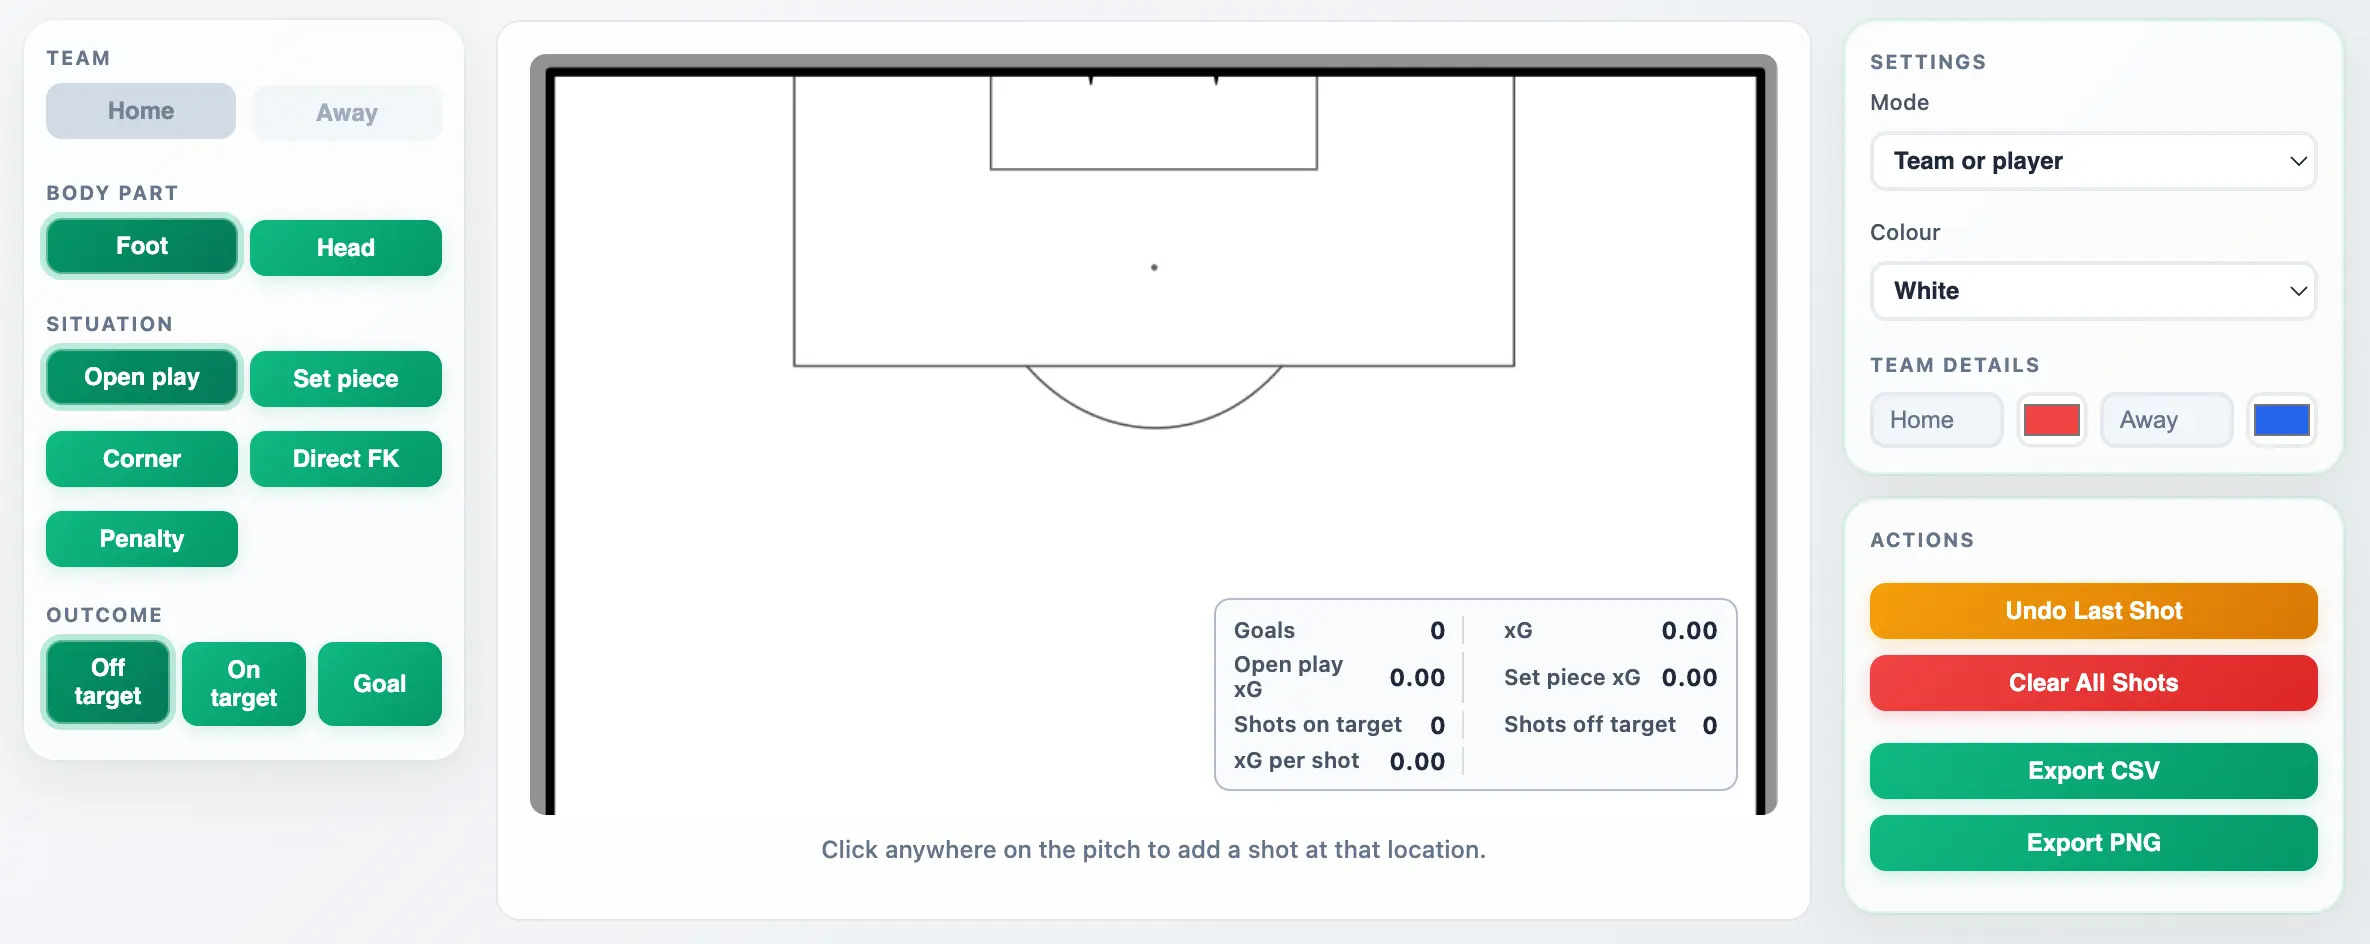
Explaining expected goals is much easier when the data lives on the pitch rather than inside a spreadsheet. DrawTactics’ football xG shot map is built for that exact job. You can place shots directly on the pitch, label teams, track outcomes, and instantly see live xG totals and shot distribution in a format that coaches, analysts, and content creators can all use.
The practical value is communication. Instead of saying, “We only created 0.8 xG,” you can show that most of your attempts came from wide or low-value areas. Instead of saying, “They did not create much,” you can show whether the opposition relied on low-quality pot shots or produced two major central chances that need reviewing.
DrawTactics helps bridge analysis and presentation with features such as:
- Match mode to compare home and away teams on one pitch
- Team or player views for more focused attacking analysis
- Live xG totals, shot counts, and outcome tracking
- PNG export for reports and presentations
- CSV export for deeper workflow analysis outside the browser
Build Your Own xG Shot Map
Turn expected goals into a visual your staff and players can understand quickly. Plot shots, compare teams, and export clean xG maps in seconds.
Open the xG Shot Map →FAQ: Expected Goals Explained
Is xG a good stat in football?
Yes, if you use it properly. xG is a strong support metric for evaluating chance quality, but it works best alongside video and tactical context rather than as a standalone verdict.
What is a good xG total in a match?
There is no universal “good” number because game state and style matter. In general, a team creating around 2.0 xG has usually produced several meaningful chances, while a team below 1.0 xG often relied on lower-value opportunities. The more useful question is how those chances were created.
What is the difference between xG and a shot map?
xG is the probability value attached to a shot. A shot map is the visual display of where shots happened. An xG shot map combines both, showing location and quality together so you can read the tactical story more quickly.
Can xG tell you who played better?
Not by itself. xG can tell you who created the better chances, which is important, but football performance also includes pressing, territory, control, transitions, and execution without the ball.
Use xG in a More Practical Workflow
If you want more than a number, use DrawTactics to turn xG into a clear visual for reviews, staff presentations, and player education.
Create Your Account →Conclusion
If you have ever asked “what is xG in football?”, the simplest answer is this: it estimates the quality of chances, not just the outcome of them. That makes it valuable for coaches and analysts who want better conversations about chance creation, shot selection, and match performance.
Used in isolation, xG can be misunderstood. Used with pitch locations and video, it becomes far more powerful. That is why an xG shot map is such a useful bridge between analytics and communication. It helps you show the story of the chances, not just recite the number.