Build clean, presentation-ready shot maps in minutes. Click shot locations, track outcomes, and generate live xG summaries for full matches or single-team analysis.
Get Started - GBP1.99/month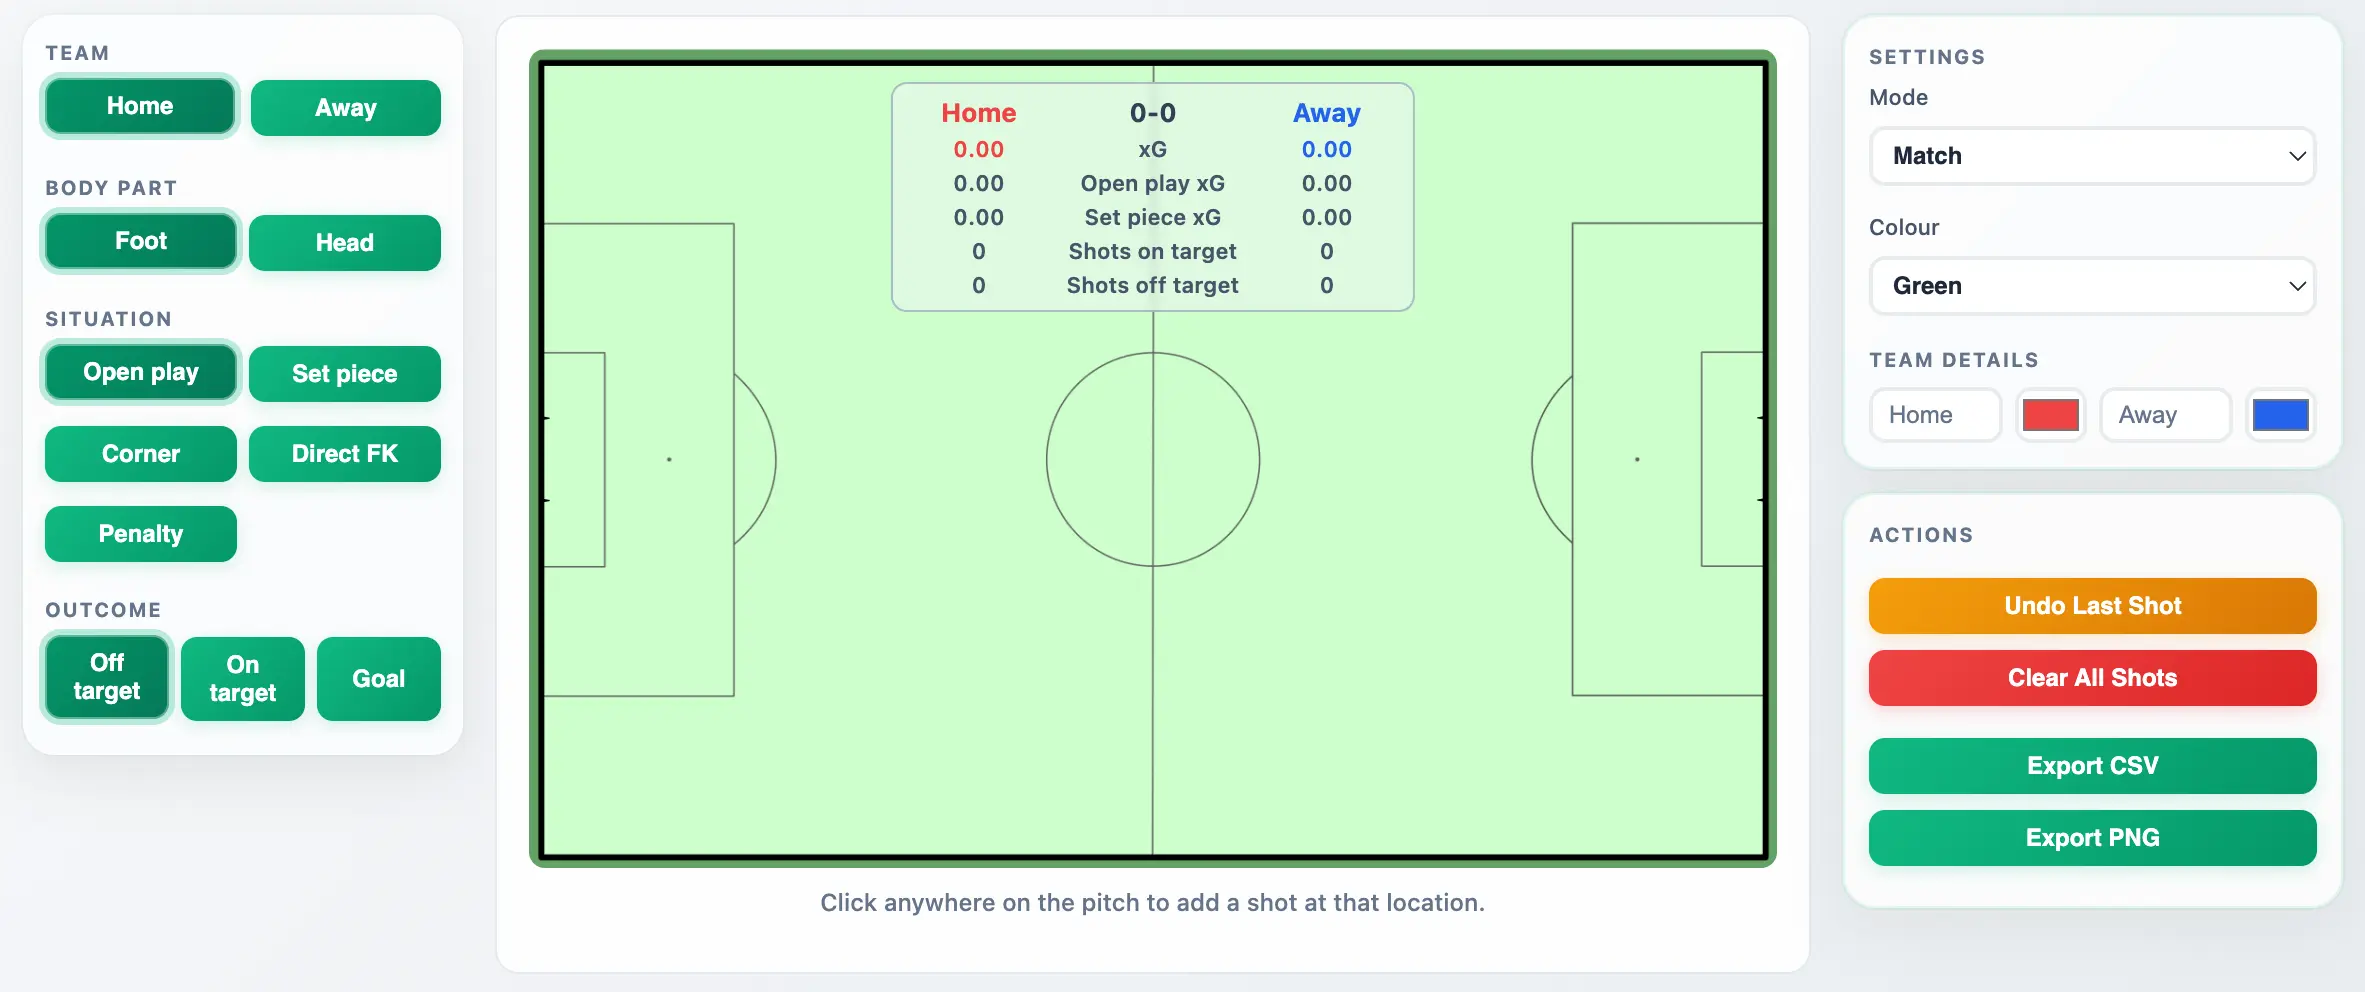
Two-team match mode with live xG, shots, and outcomes
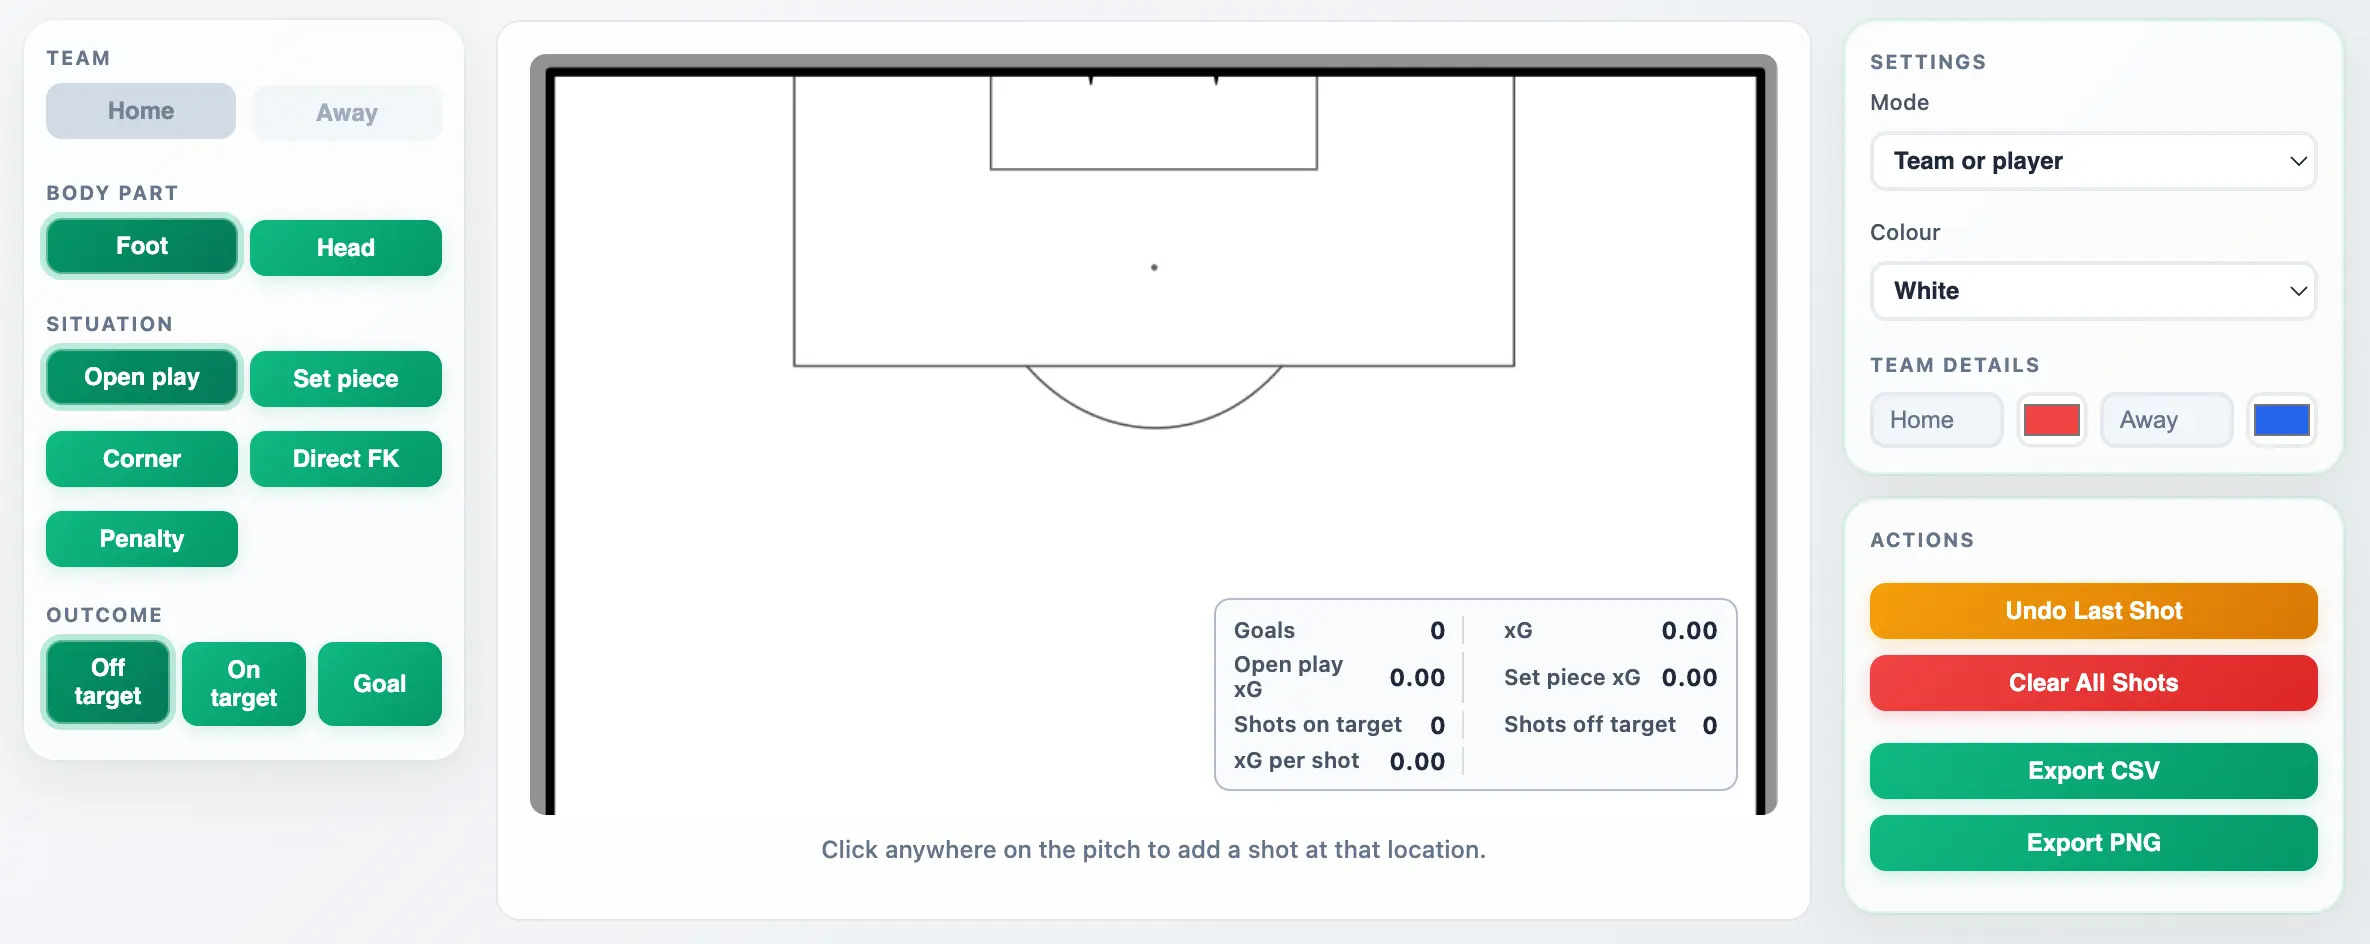
Single-team or player mode for focused attacking analysis
When you need to explain chance quality quickly, a good xG shot map says more than a table of numbers. DrawTactics lets you create your own map visually by clicking each shot location on the pitch and assigning context like situation and outcome.
As you add shots, totals update instantly. You can compare both teams in one view, or focus on one team or player in a zoomed attacking view that is ideal for post-match reports and social posts.
Click directly on the pitch to record each shot location with accurate coordinate mapping.
Mark situation and outcome to keep your analysis meaningful and your summary stats complete.
Download CSV data for workflows and PNG maps with in-pitch stats overlays for sharing.
Yes. xG is calculated as you place shots, and your map updates in real time so you can see totals, open-play xG, set-piece xG, and conversion context instantly.
Yes. Use Match mode to log home and away shots on opposite attacking ends and produce a single comparison graphic.
Yes. Team or player mode switches to a focused attacking view so your key shots are easier to interpret and present.
You can export CSV shot data and PNG shot-map graphics. PNG export includes the on-pitch stats box so it is ready to share in reports or on social.
No. DrawTactics runs in your browser. Log in, open xG Shot Map, and start plotting.
Included with your DrawTactics membership alongside your tactics board, screenshot tools, and video analysis workflow.
Start Now - GBP1.99/month